Contactless Receiving and Putaway Powered by RFID and Computer Vision
The Dock Door, Reimagined
Forklift Intelligence at the Edge
Slot Accuracy Beyond RSSI
Graceful Exceptions When Reality Gets Messy
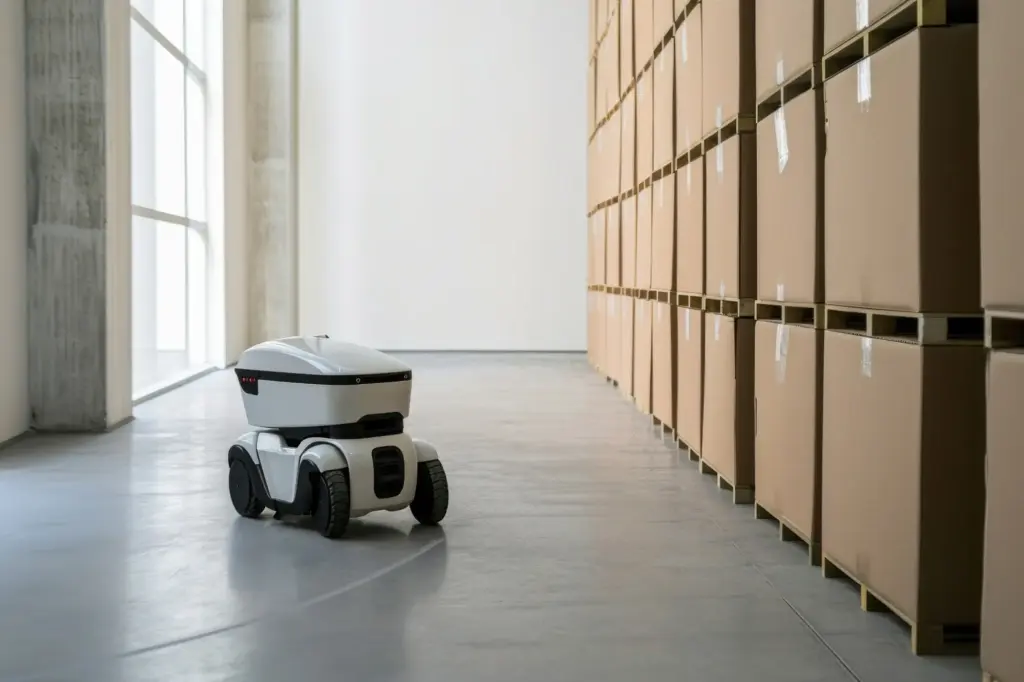
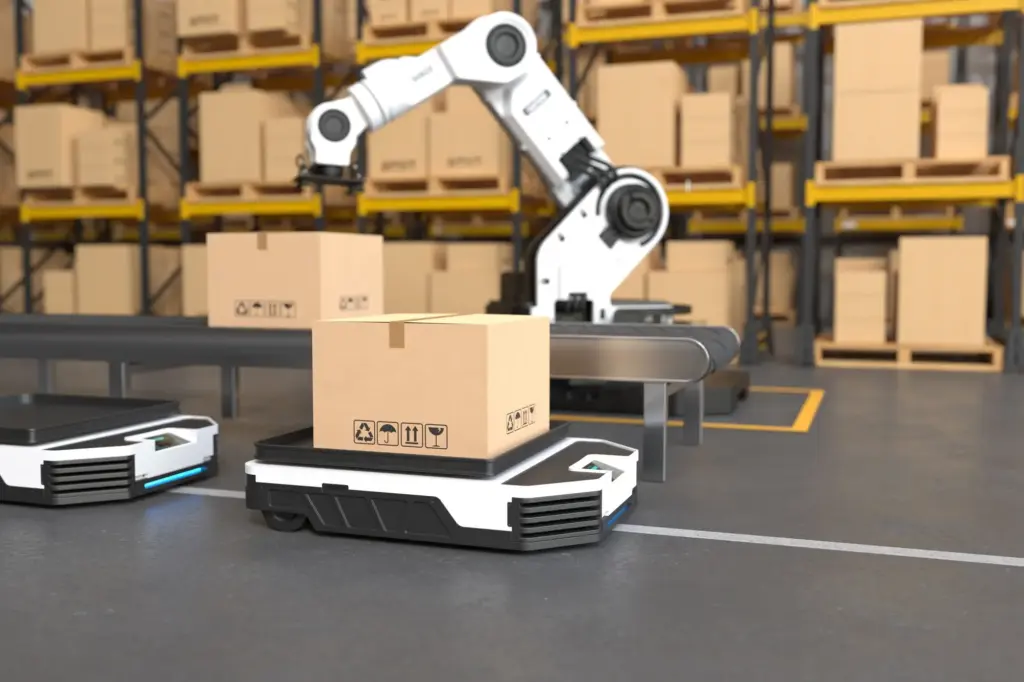
Smooth Putaway Without Stopping


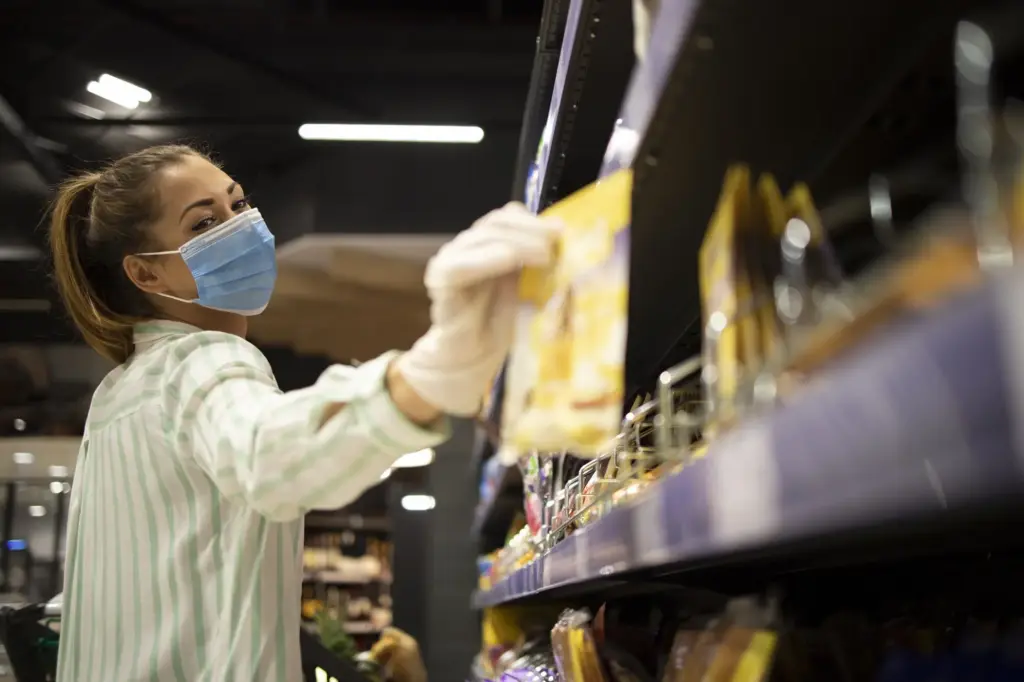
People, Safety, and Adoption
Economics That Stand Up to Scrutiny
A Practical ROI Model
Quantify baseline touches per pallet at receiving and putaway, then model reductions from hands-free identification and guided placement. Add avoided rework for misputs and research time saved by searchable images. Include portal utilization gains and reduced detention costs from faster turns. Subtract hardware, installation, support, and training. Present breakeven in months, not years, with concrete ranges. Executives sponsor rollouts when numbers connect directly to throughput, accuracy, and reliability that customers can feel.
Risks, Unknowns, and How to Mitigate
Metal-heavy lanes, dense liquids, and mirror-like stretch wrap can degrade reads and images. Site surveys reveal trouble spots early. Use tuned antenna patterns, absorber panels, consistent lighting, and hooded lenses to control glare. Plan for tag standards, mix of carton and pallet tagging, and vendor readiness. Keep a small inventory of backup handhelds for critical exceptions. With disciplined testing and incremental rollout, surprises shrink to manageable edge cases that feed continuous improvement rather than chaos.
Measure What Matters
Track receiving cycle time per pallet, first-pass match to ASN, exception resolution time, putaway misroute rate, travel distance, and operator interventions per hundred moves. Layer safety observations and worker feedback to capture human impact. Compare week-over-week with annotated changes so causality is clear. Tie incentives to stable improvements, not bursts. Metrics become motivating when teams can see their own handiwork in faster docks, cleaner bays, and mornings that start with confidence instead of catch-up.


A Warehouse Story You Can Steal From

All Rights Reserved.